> ## Documentation Index
> Fetch the complete documentation index at: https://docs.perplexity.ai/llms.txt
> Use this file to discover all available pages before exploring further.
# Competitor Buzz Tracker
> Turn a basket of searches and keyword rules into a one-page share-of-voice chart (PDF) with two chained Agent API requests. The first searches and counts inside the sandbox and returns a structured-output JSON contract. The second renders the bar chart and shares it as a downloadable file.
# Competitor Buzz Tracker
A command-line example that turns a product and its competitors into a one-page
competitive news report (PDF): how many of the articles in the news right now
mention each brand, and each brand's share of the total. You hand the tool a **basket** — a few
searches plus keyword rules — and the model does the rest.
It does this by writing the code itself. Driving the
[`sandbox`](https://docs.perplexity.ai/docs/agent-api/tools/sandbox) tool, the
model writes Python, runs it in the sandbox, and loops — searching the web,
deduplicating and classifying the results, fixing its own errors, and re-running
— all server-side. You never run any analysis or charting code locally: the
script just submits the requests, polls the background responses, and downloads
the finished PDF. Every number on the chart is computed, not guessed.
This example uses the Agent API `sandbox` tool. See the
[Sandbox docs](https://docs.perplexity.ai/docs/agent-api/tools/sandbox) for
setup and usage details.
## Usage
You describe the job in a small YAML basket: a chart title, the search
queries to run, and the keyword rules that classify each result. One article can
match several keywords — a story that mentions both Pixel and Galaxy counts for
both; one that matches none counts under "Other". More queries mean broader
coverage.
```yaml basket.yaml theme={null}
title: "iPhone vs Pixel vs Galaxy — market buzz"
queries:
- "smartphone news today"
- "latest phone news"
- "new phone launch"
- "smartphone announcements"
- "flagship smartphone news"
- "Android phone news"
- "new phone releases"
- "phone review roundup"
- "best new phones"
- "upcoming smartphones"
- "foldable phone news"
- "budget phone news"
- "phone camera comparison"
- "smartphone deals this week"
- "mobile phone industry news"
keywords:
- name: iPhone
regex: "iphone|apple phone"
- name: Pixel
regex: "pixel"
- name: Galaxy
regex: "galaxy|samsung"
```
Each keyword's `regex` is a single case-insensitive pattern — use `|` for
alternatives (e.g. `"galaxy|samsung"`). Save it as `basket.yaml`, then run:
```bash theme={null}
python competitor_buzz_tracker.py --config basket.yaml [--output FILE] [--show-code]
```
This writes `competitor-buzz-_.pdf` to the current directory. Add
`--show-code` to also print the Python the agent wrote and ran in the sandbox.
## How it works
You describe the job in plain language and hand the model the `sandbox` tool;
from there it writes the Python, runs it, fixes its own errors, and hands back
the counts and the chart — you never touch the analysis code yourself.
This example splits that work across two chained requests rather than one.
Analysis and rendering are different jobs, and splitting them keeps each prompt
short, lets you run the mechanical step on a cheaper model (`openai/gpt-5.4`) and
the rendering on the flagship (`openai/gpt-5.5`), and puts an inspectable
checkpoint in the middle.
**Request 1 (analytics)** gets the `sandbox` tool and a
[`response_format`](https://docs.perplexity.ai/docs/agent-api/output-control)
schema. The model searches each query from inside the sandbox, pools the
results, deduplicates by URL, regex-matches each article against the keyword
rules, and counts mentions per brand plus its share of voice. The schema turns
its answer into a typed contract instead of prose:
```python theme={null}
class Series(BaseModel):
model_config = ConfigDict(extra="forbid")
keyword: str
total: int
share_of_voice: float
class NewsMentions(BaseModel):
model_config = ConfigDict(extra="forbid")
title: str
articles: int
series: List[Series]
```
**Request 2 (chart)** gets only that JSON and the `sandbox` tool, then renders
the horizontal bar chart to `report.pdf` and shares it with `share_file`.
There's no shared memory between the two: the script validates request 1's JSON
against the schema and passes it into request 2, so the intermediate is plain
data you can print or unit-test before anything is drawn. Both requests run with
`background=True` and are polled until they finish, because a sandbox run can
take a while.
## Prompting guidance
You don't write the analysis code — each request describes its job as a plain
prompt, about as long as a chat message, and the model turns that into Python it
runs in the sandbox. The analytics request just sends the basket's queries and
keyword rules as its prompt:
```text theme={null}
Count how often each brand shows up in current phone news.
Search the web for each of these queries, pool the results, and drop duplicate
URLs:
- smartphone news today
- latest phone news
- ... (the rest of the basket)
Tag each article with these regexes (case-insensitive; an article can match
several; none -> "Other"):
- iPhone: iphone|apple phone
- Pixel: pixel
- Galaxy: galaxy|samsung
Return JSON: title, articles (number of unique articles), and series — for each
brand and "Other", its total and its share_of_voice.
```
The keyword rules live in the YAML, not in code, so you change what's tracked by
editing the basket — not by touching any Python.
With `--show-code`, the script prints every sandbox cell the model ran. On the
run above the analytics agent took five cells — including one that just
inspected a search result to learn its fields — before settling on the code
below. Lightly condensed, it's what it actually executed: search each query,
canonicalize and deduplicate URLs, regex-classify each result, count mentions,
and print the JSON the schema expects.
```python theme={null}
import json, re
from urllib.parse import urlsplit, urlunsplit, parse_qsl, urlencode
from collections import Counter
import pplx_sdk # search interface available inside the sandbox
queries = ["smartphone news today", "latest phone news", ...]
def canon(url): # normalize so near-duplicate URLs collapse
s = urlsplit(url)
host = s.netloc.lower().removeprefix("www.")
path = re.sub(r"/+", "/", s.path or "/").rstrip("/") or "/"
keep = [(k, v) for k, v in parse_qsl(s.query)
if not k.lower().startswith(("utm_", "fbclid", "gclid"))]
return urlunsplit((s.scheme or "https", host, path, urlencode(keep), ""))
unique = {}
for q in queries:
for h in pplx_sdk.search.web(q, limit=10):
url = getattr(h, "url", None)
if url:
unique.setdefault(canon(url), {
"title": getattr(h, "title", "") or "",
"summary": getattr(h, "summary", "") or "",
"url": url,
"domain": getattr(h, "domain", "") or "",
})
patterns = {
"iPhone": re.compile(r"iphone|apple phone", re.I),
"Pixel": re.compile(r"pixel", re.I),
"Galaxy": re.compile(r"galaxy|samsung", re.I),
}
counts = Counter()
for h in unique.values():
text = " ".join(h[k] for k in ("title", "summary", "url", "domain"))
matched = [b for b, p in patterns.items() if p.search(text)]
for b in (matched or ["Other"]):
counts[b] += 1
total = sum(counts.values())
print(json.dumps({ # the JSON contract the schema expects
"title": "iPhone vs Pixel vs Galaxy — market buzz",
"articles": len(unique),
"series": [
{"keyword": k, "total": counts[k],
"share_of_voice": round(100 * counts[k] / total, 1)}
for k in ["iPhone", "Pixel", "Galaxy", "Other"]
],
}))
```
It's regular Python you can read and sanity-check — no framework, no hidden
state. The model writes fresh code each run, so the exact shape varies between
runs. `pplx_sdk` is the search interface available inside the sandbox.
## Full code
The script is one file; cost reporting and the `--show-code` helper live in a
small `observability.py` beside it (off the critical path, so it's easy to drop
or move into shared tooling later).
```python competitor_buzz_tracker.py theme={null}
#!/usr/bin/env python3
"""
Competitor Buzz Tracker - a basket of searches and keyword rules becomes a
one-page market-buzz chart (PDF) via two Perplexity Agent API requests:
analytics (sandbox searches the web and counts -> JSON) then chart (sandbox ->
report.pdf, shared with share_file). See the README for details.
"""
import argparse
import os
import sys
import time
from datetime import datetime
from typing import Any, List, Optional, Tuple
import yaml
from pydantic import BaseModel, ConfigDict
from perplexity import Perplexity
from observability import print_costs, print_sandbox_code
POLL_INTERVAL_SECONDS = 4
POLL_TIMEOUT_SECONDS = 900
MAX_STEPS = 10
# A cheaper model handles the mechanical search-and-count; the flagship
# writes the chart code.
ANALYTICS_MODEL = "openai/gpt-5.4"
CHART_MODEL = "openai/gpt-5.5"
ANALYTICS_SYSTEM = """Work in a Python sandbox: search the web, then \
classify and count the results with code. Don't estimate the numbers - \
print the final JSON from the sandbox."""
ANALYTICS_TEMPLATE = """Count how often each brand shows up in current \
phone news.
Search the web for each of these queries, pool the results, and drop \
duplicate URLs:
{query_lines}
Tag each article with these regexes (case-insensitive; an article can \
match several; none -> "Other"):
{keyword_lines}
Return JSON: title "{title}", articles (number of unique articles), and \
series - for each brand and "Other", its total and its share_of_voice \
(its total over the sum of all totals, as a percent rounded to one \
decimal)."""
CHART_SYSTEM = """Work in a Python sandbox with matplotlib (Agg \
backend). Build the chart, save it as report.pdf, and share it with \
share_file."""
CHART_TEMPLATE = """Make a horizontal bar chart from this data.
DATA:
{data_json}
One bar per entry in "series", length = its total, sorted longest \
first, labeled with its total and share_of_voice. Title = the "title" \
field; add a subtitle with the "articles" count and \
"snapshot {snapshot_date}". Keep it clean."""
class Series(BaseModel):
model_config = ConfigDict(extra="forbid")
keyword: str
total: int
share_of_voice: float
class NewsMentions(BaseModel):
model_config = ConfigDict(extra="forbid")
title: str
articles: int
series: List[Series]
def load_basket(path: str) -> dict:
with open(path, "r", encoding="utf-8") as fh:
return yaml.safe_load(fh)
def analytics_prompt(basket: dict) -> str:
keyword_lines = "\n".join(
f" - {kw['name']}: {kw['regex']}" for kw in basket["keywords"]
)
return ANALYTICS_TEMPLATE.format(
title=basket["title"],
query_lines="\n".join(f" - {q}" for q in basket["queries"]),
keyword_lines=keyword_lines,
)
def chart_prompt(data: NewsMentions, snapshot_date: str) -> str:
return CHART_TEMPLATE.format(
data_json=data.model_dump_json(indent=2),
snapshot_date=snapshot_date,
)
def final_text(response: Any) -> str:
chunks: List[str] = []
for item in getattr(response, "output", None) or []:
if getattr(item, "type", None) != "message":
continue
for block in getattr(item, "content", None) or []:
if getattr(block, "type", None) == "output_text":
text = getattr(block, "text", None)
if text:
chunks.append(text)
return "\n\n".join(chunks)
def ran_sandbox(response: Any) -> bool:
return any(
getattr(item, "type", None) == "sandbox_results"
for item in getattr(response, "output", None) or []
)
def submit_and_wait(client: Perplexity, **create_kwargs: Any) -> Any:
response = client.responses.create(background=True, **create_kwargs)
print(f"Submitted response {response.id}; working...", file=sys.stderr)
deadline = time.time() + POLL_TIMEOUT_SECONDS
while response.status in ("queued", "in_progress"):
if time.time() > deadline:
raise TimeoutError("Timed out waiting for the response to finish.")
time.sleep(POLL_INTERVAL_SECONDS)
response = client.responses.retrieve(response.id)
if response.status != "completed":
raise RuntimeError(f"Request ended with status {response.status!r}.")
return response
def run_analytics(
client: Perplexity, basket: dict, model: str
) -> Tuple[NewsMentions, Any]:
response = submit_and_wait(
client,
model=model,
instructions=ANALYTICS_SYSTEM,
input=analytics_prompt(basket),
tools=[{"type": "sandbox"}],
response_format={
"type": "json_schema",
"json_schema": {
"name": "news_mentions",
"schema": NewsMentions.model_json_schema(),
},
},
max_steps=MAX_STEPS,
)
if not ran_sandbox(response):
raise RuntimeError("Analytics request did not run the sandbox.")
return NewsMentions.model_validate_json(final_text(response)), response
def run_chart(
client: Perplexity, data: NewsMentions, snapshot_date: str, model: str
) -> Any:
return submit_and_wait(
client,
model=model,
instructions=CHART_SYSTEM,
input=chart_prompt(data, snapshot_date),
tools=[{"type": "sandbox"}],
max_steps=MAX_STEPS,
)
def download_pdf(
client: Perplexity, response: Any, output: Optional[str]
) -> Optional[str]:
files = client.responses.files.list(response.id)
pdf = next(
(f for f in files.data if f.filename.lower().endswith(".pdf")), None
)
if pdf is None:
names = ", ".join(f.filename for f in files.data) or "(none)"
print(
f"No PDF was shared by the sandbox. Files: {names}",
file=sys.stderr,
)
return None
stamp = datetime.now().strftime("%Y-%m-%d_%H-%M")
out_path = output or f"competitor-buzz-{stamp}.pdf"
content = client.responses.files.content(pdf.id, response_id=response.id)
content.write_to_file(out_path)
return out_path
def main() -> int:
parser = argparse.ArgumentParser(
description=(
"Generate a one-page market-buzz chart (PDF) from a basket "
"config, using two Perplexity Agent API requests (analytics, "
"then chart)."
)
)
parser.add_argument(
"--config",
default="basket.yaml",
help="Path to the basket YAML config (default: basket.yaml).",
)
parser.add_argument(
"--output",
help=(
"Output PDF path. Defaults to competitor-buzz-.pdf in the "
"working directory."
),
)
parser.add_argument(
"--show-code",
action="store_true",
help="Print the Python the agent wrote and ran in the sandbox.",
)
args = parser.parse_args()
if not os.environ.get("PERPLEXITY_API_KEY"):
print("Set PERPLEXITY_API_KEY in your environment.", file=sys.stderr)
return 1
basket = load_basket(args.config)
client = Perplexity()
names = ", ".join(kw["name"] for kw in basket["keywords"])
snapshot_date = datetime.now().date().isoformat()
try:
print(
f"[1/2] Measuring news buzz for {names}...", file=sys.stderr
)
data, analytics_response = run_analytics(
client, basket, ANALYTICS_MODEL
)
parts = [
f"{s.keyword} {s.total} ({s.share_of_voice}%)"
for s in data.series
]
print(
f" {data.articles} articles - {', '.join(parts)}",
file=sys.stderr,
)
print("[2/2] Rendering the report PDF...", file=sys.stderr)
chart_response = run_chart(
client, data, snapshot_date, CHART_MODEL
)
except Exception as err: # noqa: BLE001
print(f"Error: {err}", file=sys.stderr)
return 2
out_path = download_pdf(client, chart_response, args.output)
if args.show_code:
print_sandbox_code(analytics_response, "analytics")
print_sandbox_code(chart_response, "chart")
print_costs(
[("Analytics", analytics_response), ("Chart", chart_response)]
)
if out_path:
print(f"\nSaved report to {out_path}", file=sys.stderr)
return 0
return 3
if __name__ == "__main__":
sys.exit(main())
```
```python observability.py theme={null}
"""Optional observability helpers for the Competitor Buzz Tracker.
Kept in a separate module so the main script stays focused on the Agent API
calls. Nothing here is on the critical path (cost reporting and showing the
code the model ran), so it could later move into shared tooling or the SDK.
"""
import sys
from typing import Any, List, Tuple
def print_costs(stages: List[Tuple[str, Any]]) -> None:
"""Print per-request cost and the combined total to stderr."""
amounts: List[float] = []
currency = "USD"
for label, response in stages:
cost = getattr(getattr(response, "usage", None), "cost", None)
total = getattr(cost, "total_cost", None)
if total is not None:
currency = getattr(cost, "currency", "USD")
amounts.append(total)
print(f"{label} cost: {total:.4f} {currency}", file=sys.stderr)
if amounts:
print(f"Total cost: {sum(amounts):.4f} {currency}", file=sys.stderr)
def sandbox_code(response: Any) -> List[str]:
"""Return the code cells the model wrote and ran in the sandbox."""
cells: List[str] = []
for item in getattr(response, "output", None) or []:
if getattr(item, "type", None) != "sandbox_results":
continue
data = item.model_dump() if hasattr(item, "model_dump") else {}
code = data.get("code")
if code:
cells.append(code)
return cells
def print_sandbox_code(response: Any, label: str = "") -> None:
"""Print the code the model ran in the sandbox (for inspection)."""
cells = sandbox_code(response)
if not cells:
return
where = f" [{label}]" if label else ""
print(f"--- sandbox code{where} ---", file=sys.stderr)
for i, code in enumerate(cells, 1):
print(f"\n# cell {i}/{len(cells)}", file=sys.stderr)
print(code, file=sys.stderr)
```
## Example Output
A real run — `python competitor_buzz_tracker.py --config basket.yaml`
(results vary with live coverage):
```
[1/2] Measuring news buzz for iPhone, Pixel, Galaxy...
Submitted response resp_b89831b8-cb87-41ef-8756-1b9447fb19d7; working...
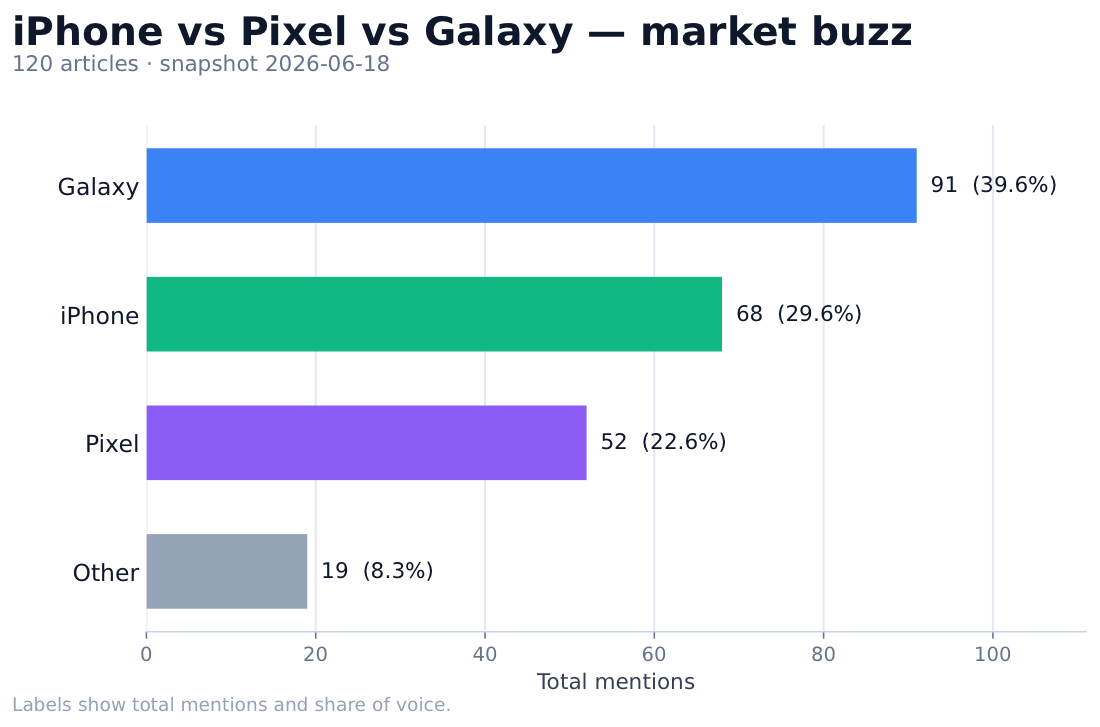
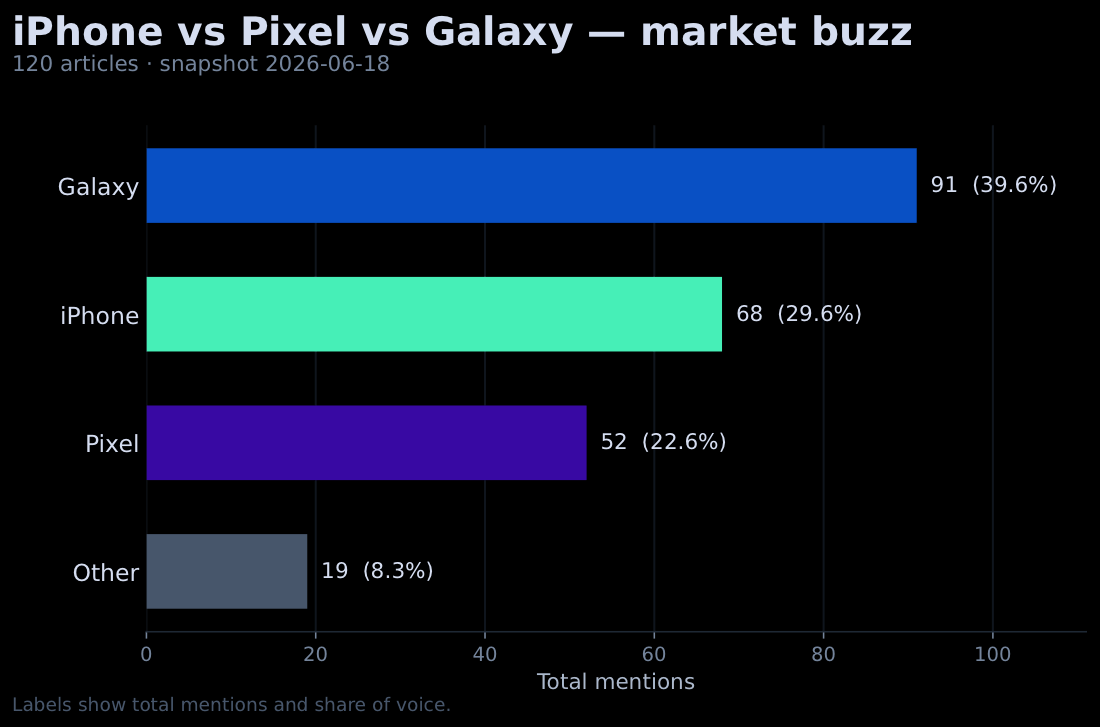
120 articles - iPhone 68 (29.6%), Pixel 52 (22.6%), Galaxy 91 (39.6%), Other 19 (8.3%)
[2/2] Rendering the report PDF...
Submitted response resp_93c0ab7d-325a-4101-9655-cc4ad40863c3; working...
Analytics cost: 0.2515 USD
Chart cost: 0.0567 USD
Total cost: 0.3083 USD
Saved report to competitor-buzz-2026-06-18_21-12.pdf
```
The PDF is a horizontal bar chart of mentions per brand, sorted, each bar labeled
with its total and share of voice, under a subtitle showing the article count and
`snapshot `. Every count comes from search results the model actually
classified with the keyword rules — not from its training data. (Shares are
rounded to one decimal, so they may not sum to exactly 100%.)
## Limitations
* **Coverage varies.** Output depends on live news, so counts differ by topic and
over time.
* **Billing.** This makes two Agent API requests, so each run is billed for two
sets of model tokens and two sandbox sessions, plus the in-sandbox searches in
request 1, at their standard rates.
## Resources
* [Sandbox Tool](https://docs.perplexity.ai/docs/agent-api/tools/sandbox)
* [Structured Outputs](https://docs.perplexity.ai/docs/agent-api/output-control)
* [Agent API Quickstart](https://docs.perplexity.ai/docs/agent-api/quickstart)
* [Search API](https://docs.perplexity.ai/docs/search/quickstart)
* [Pricing](https://docs.perplexity.ai/docs/getting-started/pricing)
* [Perplexity Python SDK](https://github.com/ppl-ai/perplexity-python)
 ## What the sandbox does here
* **Runs the analysis as code, not from memory.** Like a code interpreter, the
sandbox lets the model solve a quantitative task by writing and running Python
instead of guessing. The mention counts and share-of-voice percentages come
from code it actually executed over the search results — so the numbers are
real, not plausible-sounding. The script enforces this: it checks the response
contains a `sandbox_results` item and refuses the result otherwise, so the
model can't skip the tool and return invented counts.
* **Searches the web in the same run.** The sandbox can reach Perplexity search
from inside the run, so the model pulls the articles itself and classifies them
in the same request — no separate scraping step, no glue code, no extra tool to
wire up.
* **Returns a real file with zero setup on your side.** matplotlib and the
runtime live in the sandbox; the model renders the chart, shares it with
`share_file`, and you download the `.pdf` from the response by id. One request
in, one file out — nothing to install or host locally. A plain chat completion
would only return text.
## Without the sandbox
To build the same report yourself, you'd stand up a runtime: a machine with
Python and matplotlib, the search and classification code, and somewhere to
execute it and capture the file. With the `sandbox` tool the model writes and
runs that code server-side and hands back the finished PDF — nothing to install,
host, or keep running — and it adapts the code to whatever the search returns
instead of you maintaining a rigid pipeline.
## Installation
Keep the project files in the same directory:
`competitor_buzz_tracker.py`, `observability.py` (imported by the script),
`requirements.txt`, and your `basket.yaml`.
1. Install the dependencies — the [Perplexity Python SDK](https://github.com/ppl-ai/perplexity-python),
PyYAML (to read the basket config), and Pydantic (for the response schema).
They're pinned in `requirements.txt`:
```text requirements.txt theme={null}
perplexityai==0.38.0
PyYAML==6.0.2
pydantic==2.13.4
```
```bash theme={null}
pip install -r requirements.txt
```
2. Set your Perplexity API key:
```bash theme={null}
export PERPLEXITY_API_KEY="your-api-key-here"
```
The SDK reads the key from this environment variable.
## What the sandbox does here
* **Runs the analysis as code, not from memory.** Like a code interpreter, the
sandbox lets the model solve a quantitative task by writing and running Python
instead of guessing. The mention counts and share-of-voice percentages come
from code it actually executed over the search results — so the numbers are
real, not plausible-sounding. The script enforces this: it checks the response
contains a `sandbox_results` item and refuses the result otherwise, so the
model can't skip the tool and return invented counts.
* **Searches the web in the same run.** The sandbox can reach Perplexity search
from inside the run, so the model pulls the articles itself and classifies them
in the same request — no separate scraping step, no glue code, no extra tool to
wire up.
* **Returns a real file with zero setup on your side.** matplotlib and the
runtime live in the sandbox; the model renders the chart, shares it with
`share_file`, and you download the `.pdf` from the response by id. One request
in, one file out — nothing to install or host locally. A plain chat completion
would only return text.
## Without the sandbox
To build the same report yourself, you'd stand up a runtime: a machine with
Python and matplotlib, the search and classification code, and somewhere to
execute it and capture the file. With the `sandbox` tool the model writes and
runs that code server-side and hands back the finished PDF — nothing to install,
host, or keep running — and it adapts the code to whatever the search returns
instead of you maintaining a rigid pipeline.
## Installation
Keep the project files in the same directory:
`competitor_buzz_tracker.py`, `observability.py` (imported by the script),
`requirements.txt`, and your `basket.yaml`.
1. Install the dependencies — the [Perplexity Python SDK](https://github.com/ppl-ai/perplexity-python),
PyYAML (to read the basket config), and Pydantic (for the response schema).
They're pinned in `requirements.txt`:
```text requirements.txt theme={null}
perplexityai==0.38.0
PyYAML==6.0.2
pydantic==2.13.4
```
```bash theme={null}
pip install -r requirements.txt
```
2. Set your Perplexity API key:
```bash theme={null}
export PERPLEXITY_API_KEY="your-api-key-here"
```
The SDK reads the key from this environment variable.