Features
- Natural Language to Dashboards: Convert plain English prompts into fully functional analytics dashboards with 25+ widget types
- Live Data Integration: Blend your own data sources with real-time web data for comprehensive insights
- Interactive Grid Layout: Drag-and-drop interface for customizing dashboard layouts and styling
- AI-Powered Refinement: Refine or add widgets using conversational updates
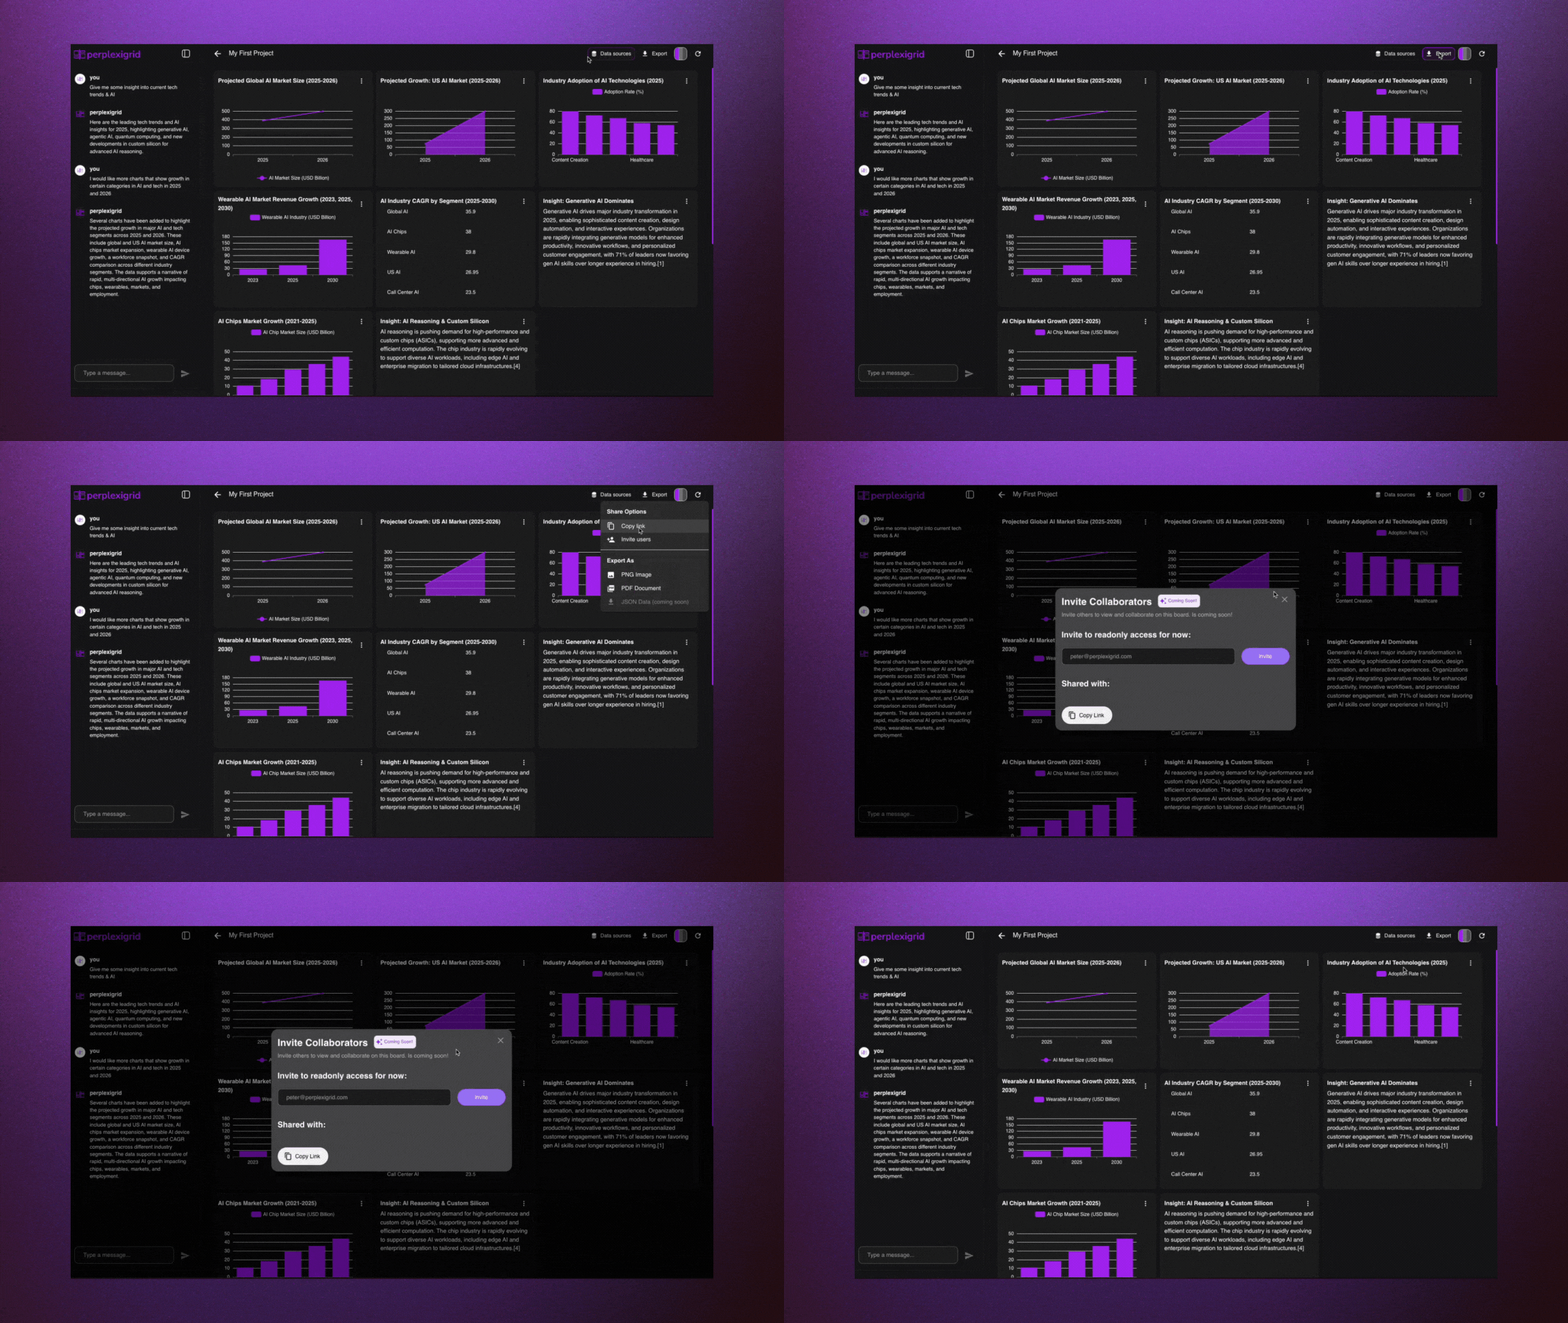
- Export & Share: Generate PDF exports, high-res images, and shareable dashboard links
How it uses Sonar
PerplexiGrid leverages the Sonar API through four specialized modes:- Full Dashboard Generation (f1): Creates comprehensive dashboards with multiple widgets using Sonar Pro’s advanced capabilities
- Lightweight Mode (l1): Generates quick visualizations for embedded systems and real-time applications
- Dashboard Updates (r1): Enables dynamic modifications through natural language while maintaining context
- Widget Refinement (r2): Provides precise control over individual widget updates
Usage
- Open the app and start a new dashboard
- Prompt it like: “Show me market trends in AI startups in 2024” (Sonar generates chart configs, which are parsed and rendered as live widgets)
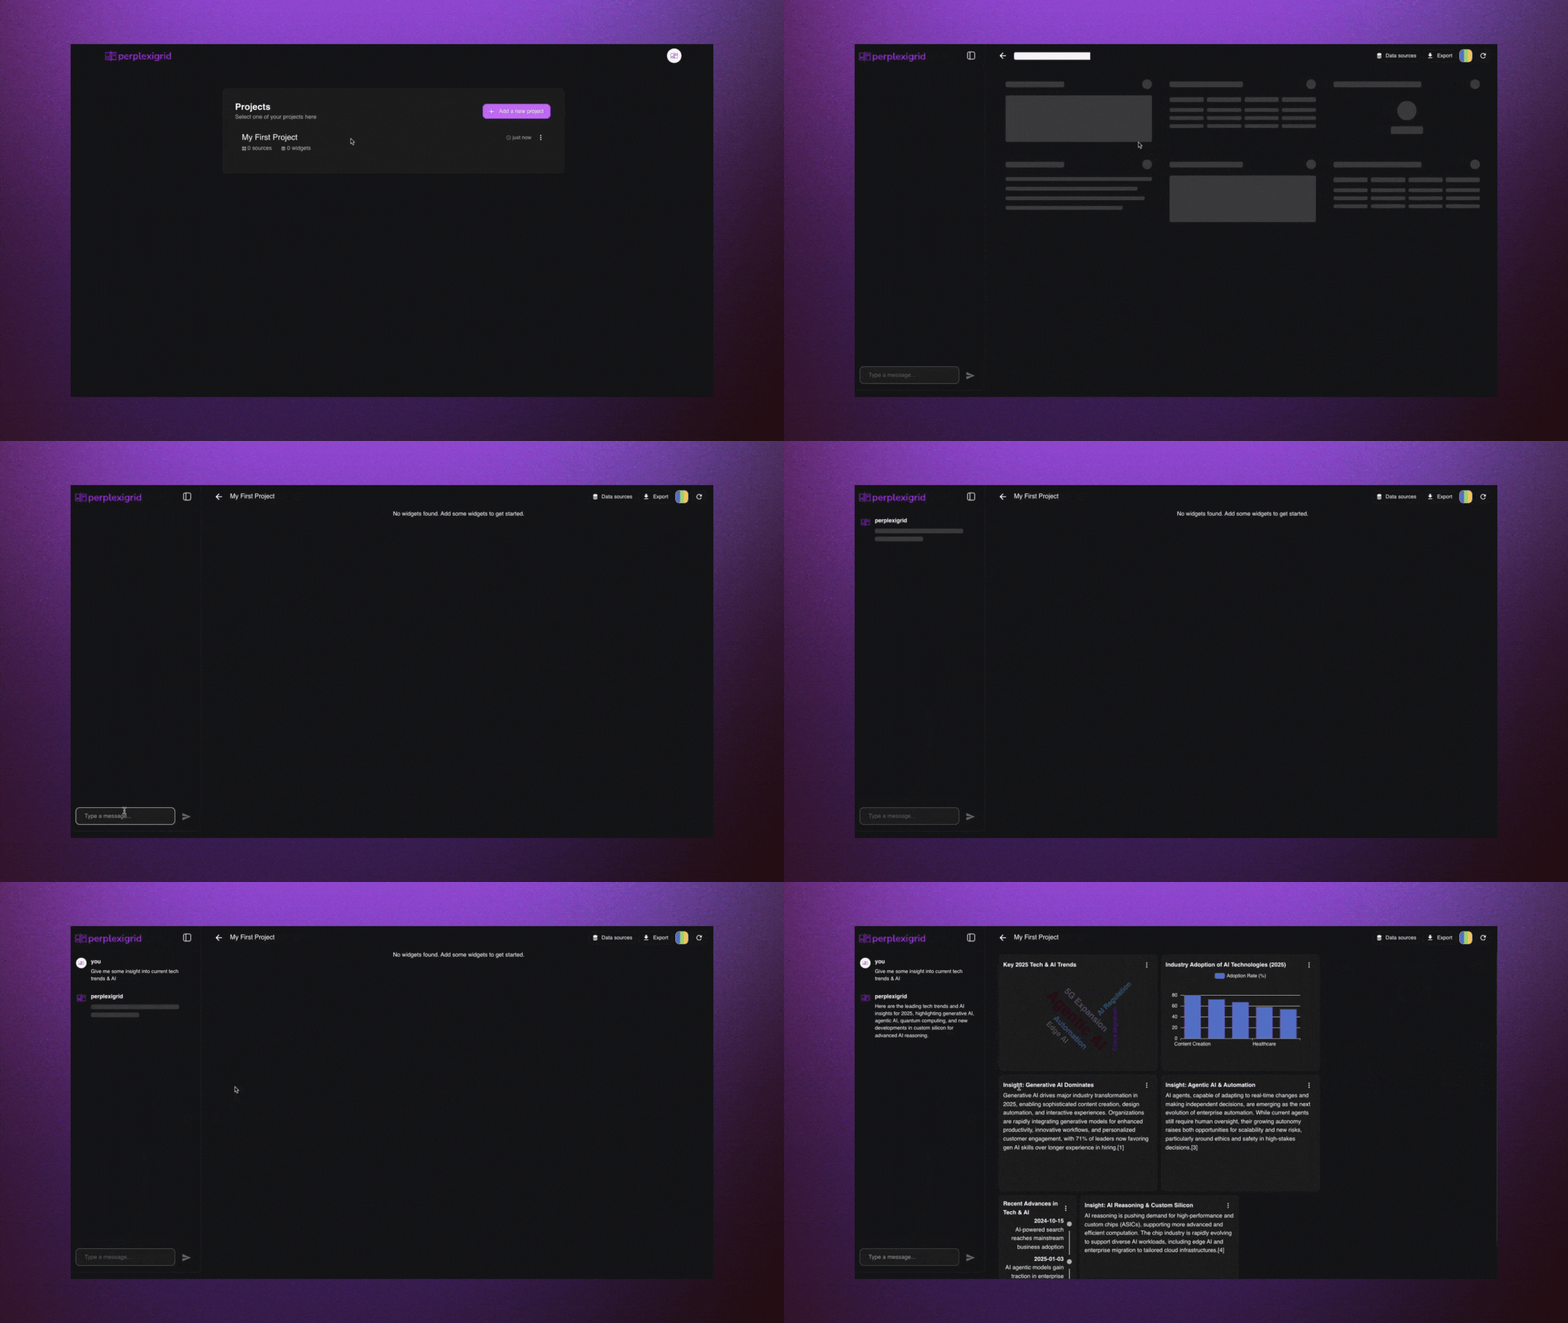
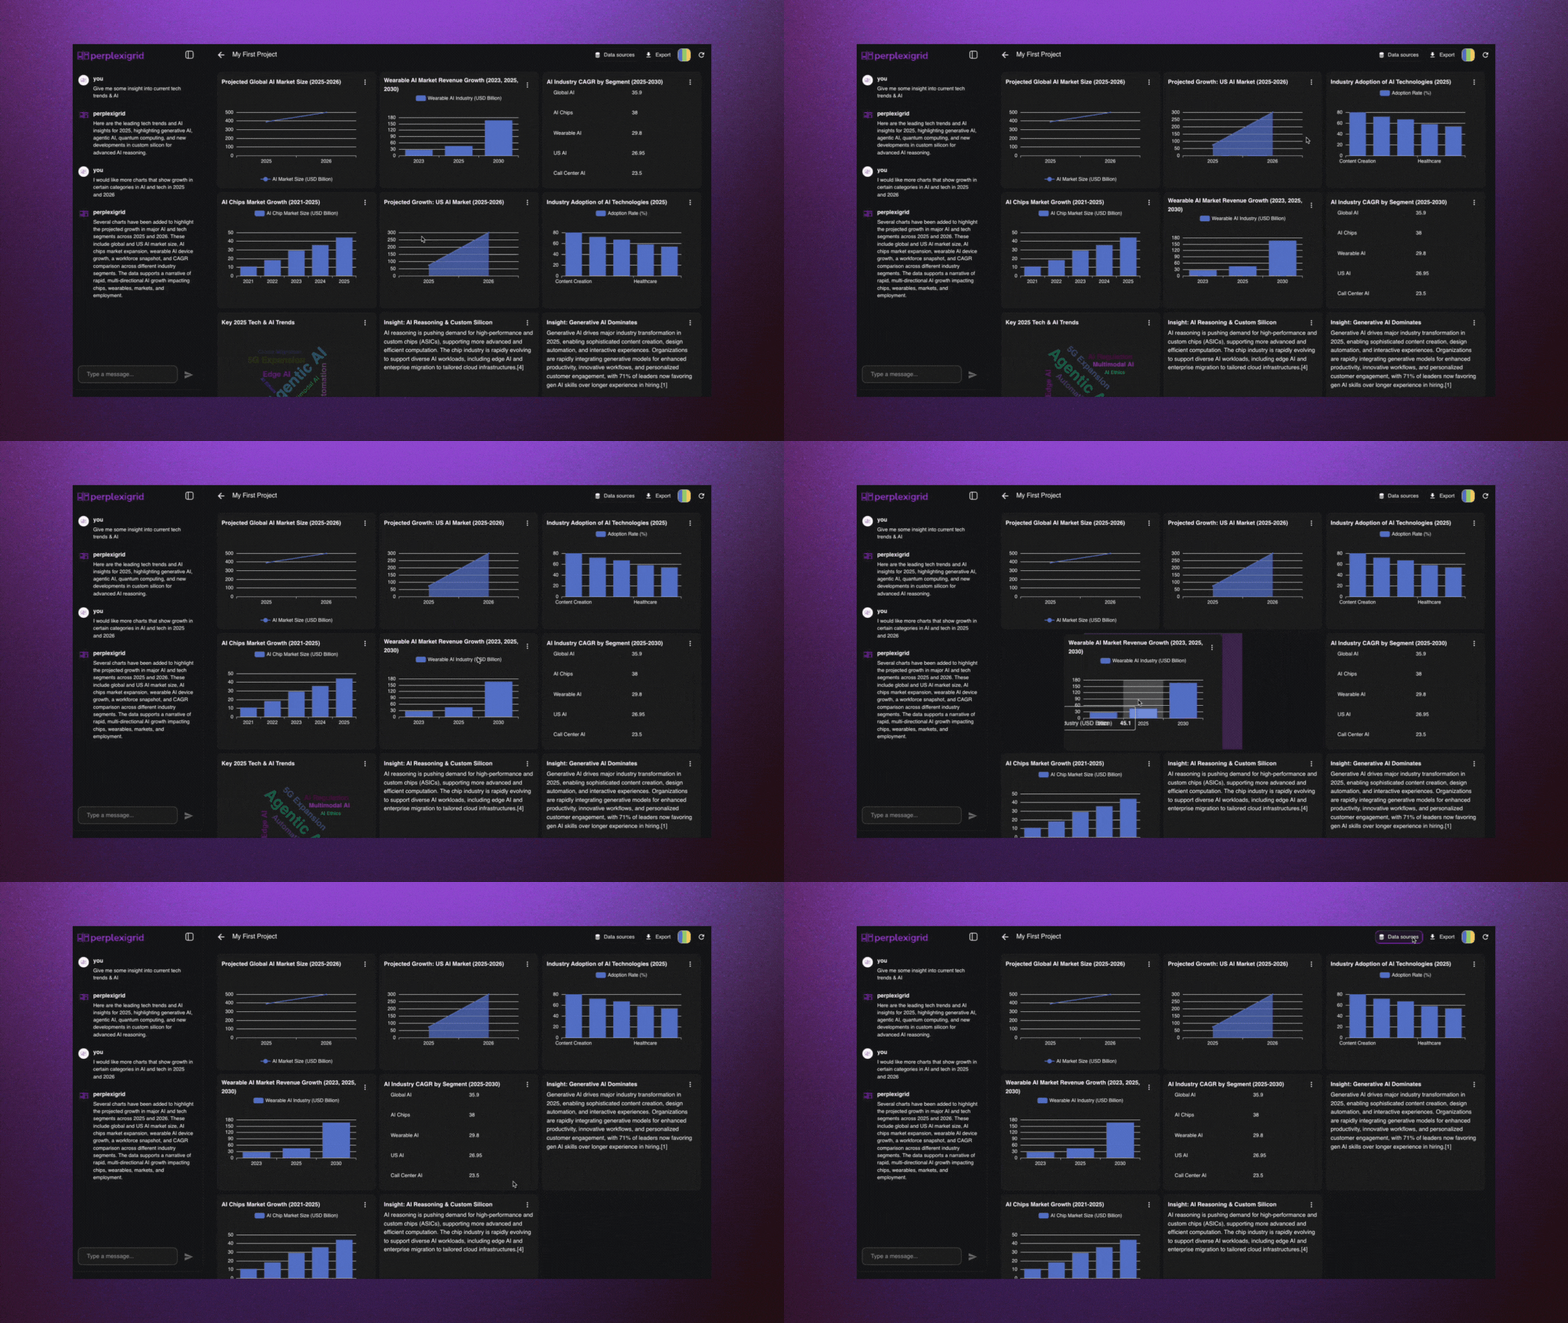
- Rearrange and style the widgets with the grid interface
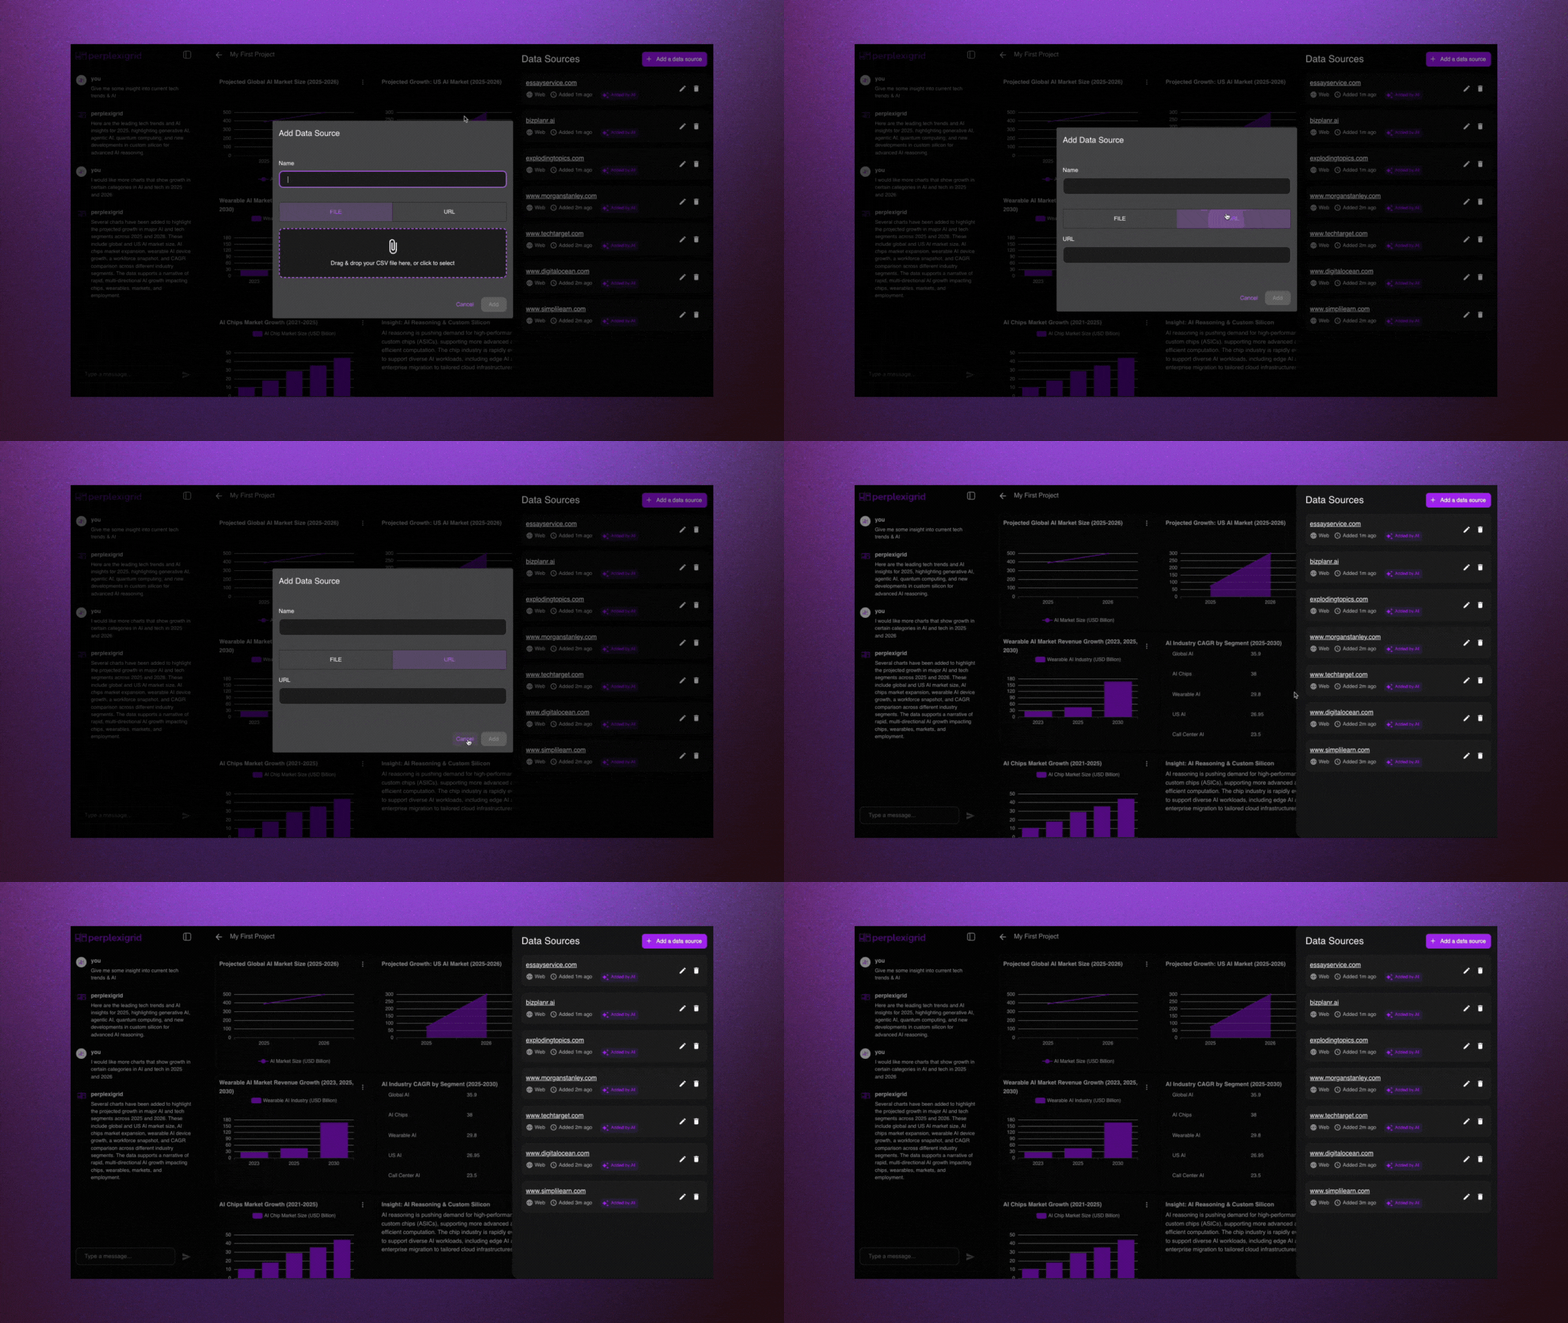
- Add your own datasources to blend your data with live web data
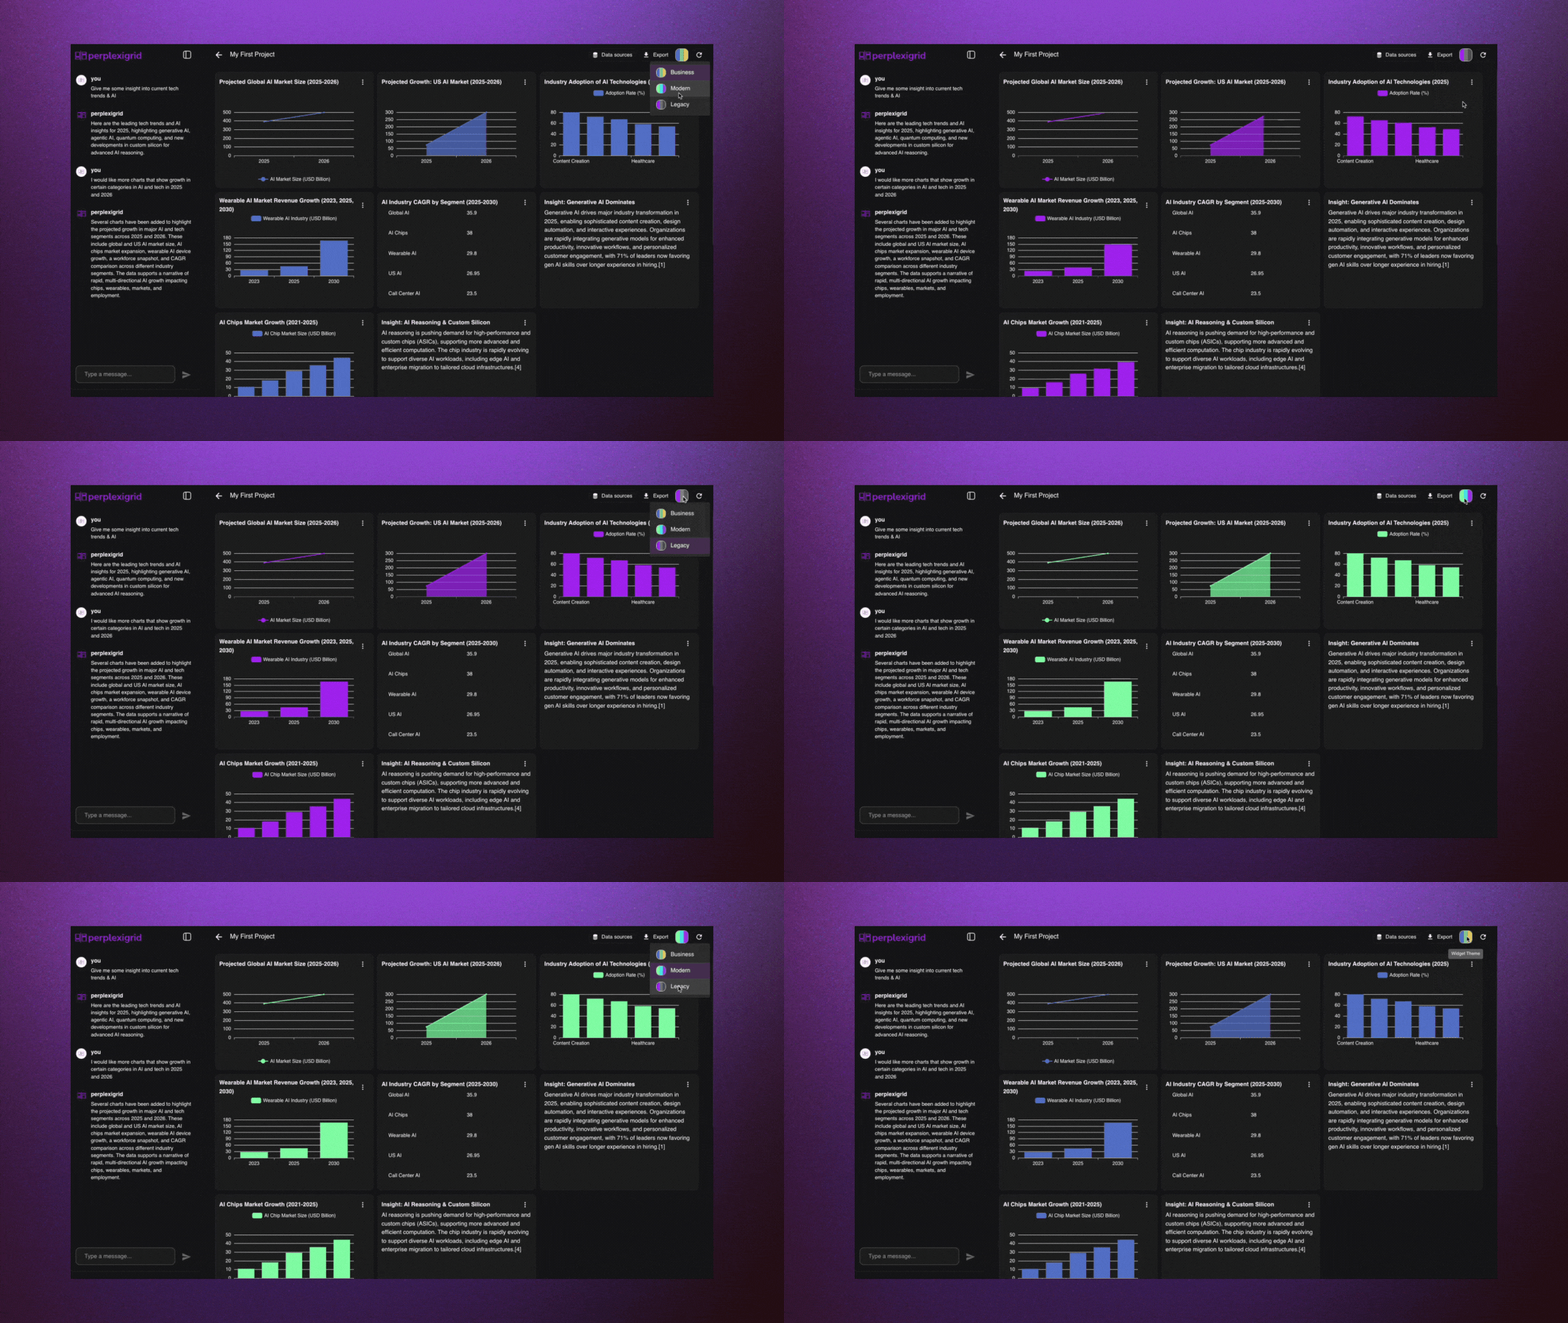
- Refine them via text prompts or export the dashboard as needed
- Collaborate and share easily
Code Explanation
The user sends messages that are turned into prompts to a Supabase Edge Function that wraps the Perplexity Sonar API.Depending on the mode (
f1, l1, r1, or r2), the function generates full structured outputs for dashboards, lightweight visualizations, or targeted updates.The generated layout is parsed into structured widget definitions and passed through our widget creation engine. Explore our main sonar-api service here.
Prompt Modes
| Mode | Description | Use Case | Notes |
|---|---|---|---|
f1 | First-time full dashboard generation | User starts with an empty canvas and enters an initial prompt | Produces a complete dashboard layout with multiple widgets |
l1 | Lightweight dashboard generation | Used for quick insights or previews with minimal tokens | Faster and cheaper, but returns fewer widgets with less instruction depth |
r1 | Full dashboard regeneration | User wants to replace all existing widgets with a new prompt | Rebuilds the entire dashboard while keeping layout intact |
r2 | Targeted widget update | User wants to change a specific widget (e.g. “make this a pie chart”) | Only the selected widget is modified based on the new instruction |
Tech Stack
- Frontend: React + Vite (TypeScript), ECharts, react-grid-layout
- Backend: Supabase Edge Functions (TypeScript on Deno)
- AI Engine: Perplexity Sonar Pro
- Infrastructure: Supabase (PostgreSQL, RLS, Auth), Vercel deployment