

Preview the Agent API request
Preview the Agent API request
What Agent API does for your application
You will configure the analyst once, ask it to investigate, then continue the conversation to get an enterprise chart. Each part of the experience uses an Agent API customization: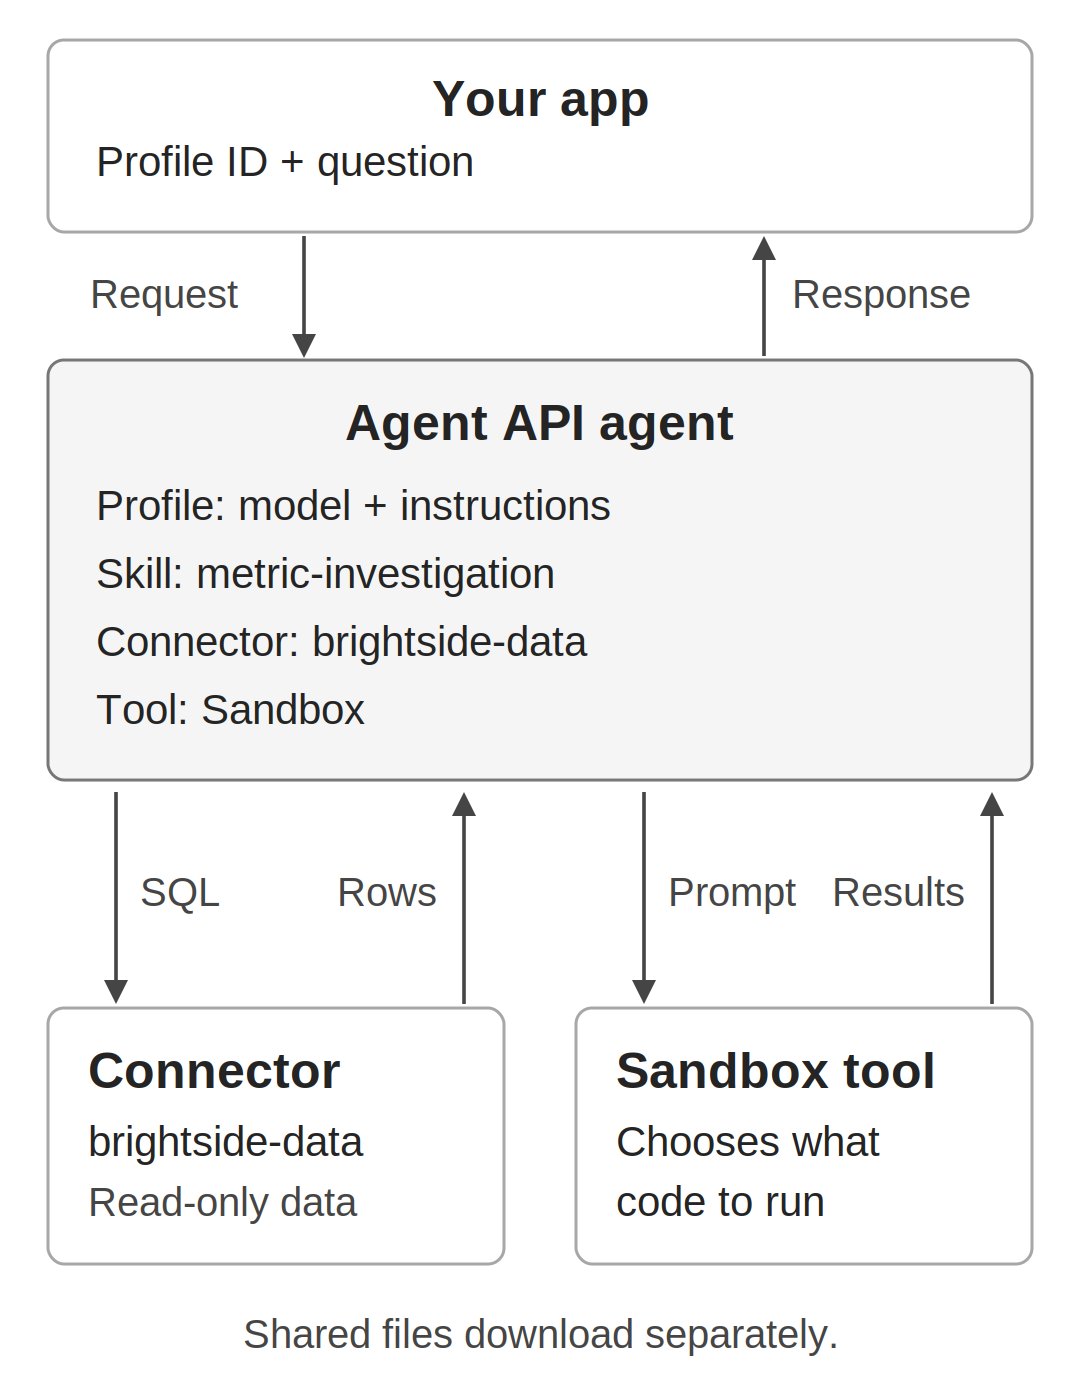
Prepare your project
You need Python 3.12 or newer, an API Project with credits, and a Project API key. A Project administrator configures the connector, skill, and profile. Once you save that configuration, org members can use the analyst profile in their applications. The terminal commands use Bash. On macOS, runbash in each terminal before following them; on Windows, use a Bash terminal in WSL.
Choose your data path before starting. The local server is sample infrastructure, not an Agent API requirement.
The example uses Brightside Coffee, a fictional subscription business. Its metric counts non-test accounts that signed up and started a paid subscription in the same Monday-to-Sunday week. To reproduce the questions and counts, your connector must serve this sample’s data and context through
describe_tables, search_context, and run_sql. For another data source, adapt the tools, skill, instructions, schema, and SQL dialect; the Brightside results will not apply.
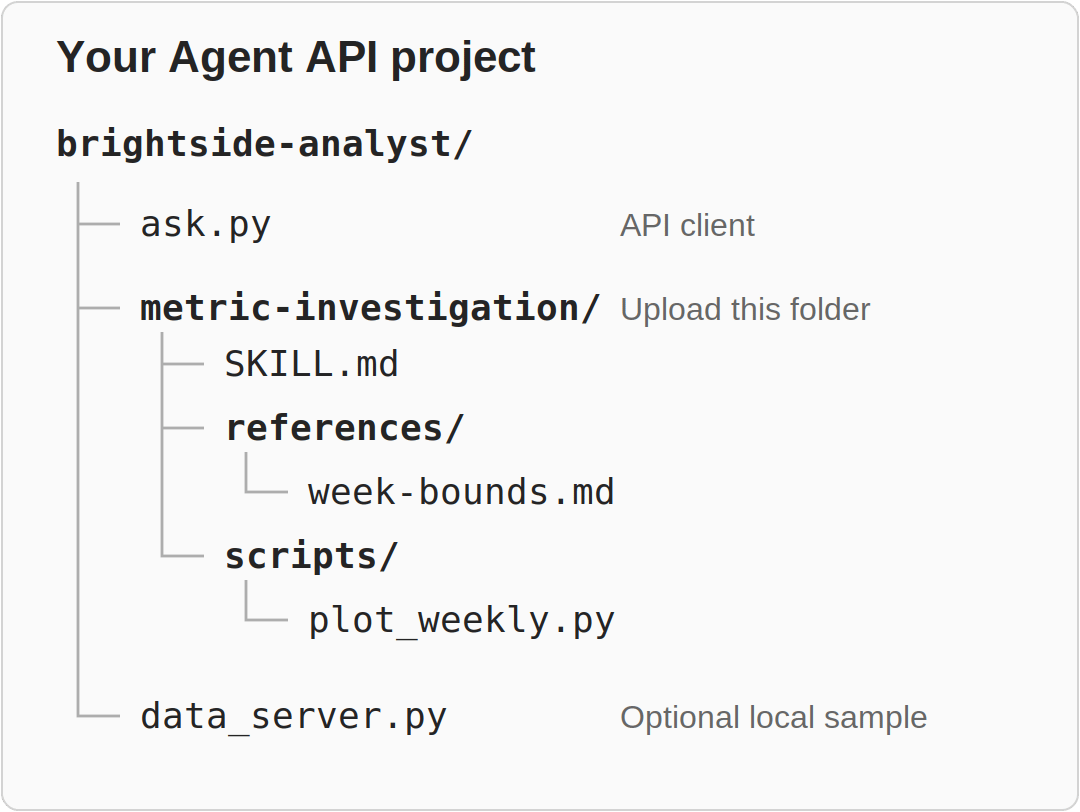
Plan the files before creating them
Your application has one file:ask.py. The skill is one folder containing its instructions, SQL reference, and chart helper, packaged together as a ZIP. Add data_server.py only for the local sample; it includes its own data and company context.
Create the folders and install the Perplexity Python library
Create the folders and install the Perplexity Python library
Write your Agent API client
Createask.py in the working folder and copy the complete file below. It calls Agent API and records what happened; it does not implement the analyst’s investigation.
ask.py
ask.py
- Imports and paths: Load the command-line, JSON, environment, file, and API helpers.
RUNSstores responses;LAST_RESPONSEstores the conversation checkpoint. ask(): Callclient.responses.create()with a profile and question. Optional arguments select a profile version, override the model, or continue a conversation.show_work(): Save the complete response and print its answer, tool activity, errors, and reported cost. Only completed responses advance the checkpoint.download_files(): Retrieve shared files through the response files endpoints. Use per-response folders, reject path-like names, and refuse overwrites.main()and the entry point: Parse your flags, create the API client, send the request, and handle the response. Reject a follow-up without a valid checkpoint.
Configure your Agent API analyst
Give the agent a reusable investigation method
Use themetric-investigation skill to tell the agent how to investigate, rather than repeating the method in every question. Its description explains when to load it; its instructions ask the agent to check definitions, compare consistent weeks, investigate tracking changes, and show evidence.
Keep the skill as a folder so its instructions, reference, and chart helper travel together. You can download the complete skill ZIP, or create these three files at the paths shown.
metric-investigation/SKILL.md
metric-investigation/SKILL.md
SKILL.md contains the investigation sequence and answer format. For charts, it asks the agent to prompt Sandbox with the query results and request the bundled helper.
metric-investigation/references/week-bounds.md
metric-investigation/references/week-bounds.md
metric-investigation/scripts/plot_weekly.py
metric-investigation/scripts/plot_weekly.py
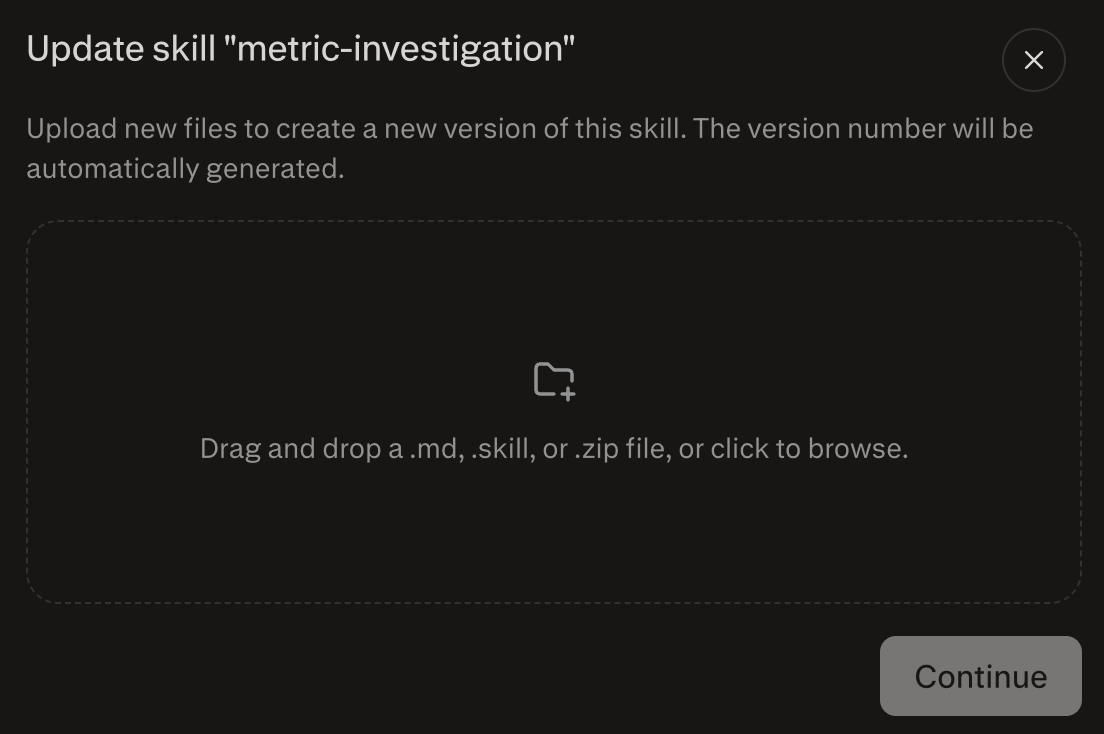
metric-investigation/ folder, not SKILL.md alone:
Package the skill
Package the skill
metric-investigation.zip into the upload area, or click to browse, then select Continue.
Connect the agent to your data
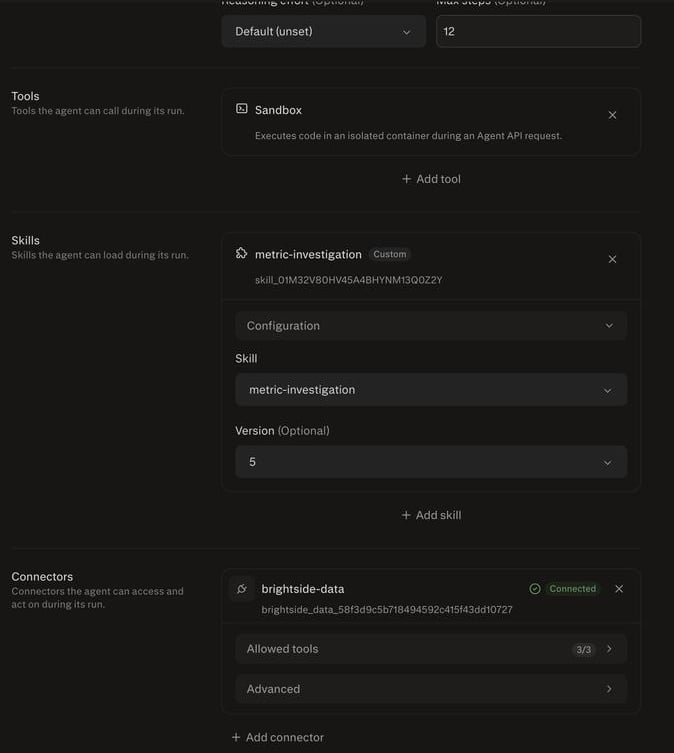
Your connector lets Agent API access the data tools without giving your application the server’s credential. If you already have a compatible hosted connector in this Project, select it in the profile below and skip server setup. If you need the synthetic Brightside server, follow Run the sample server locally, then return here with its HTTPS URL and token. Register it on the Project connectors page:- Name:
brightside-data - MCP server URL: Your server’s HTTPS URL plus
/mcp - Authentication: API Key, using your
DATA_SERVER_KEY - Transport: Streamable HTTP
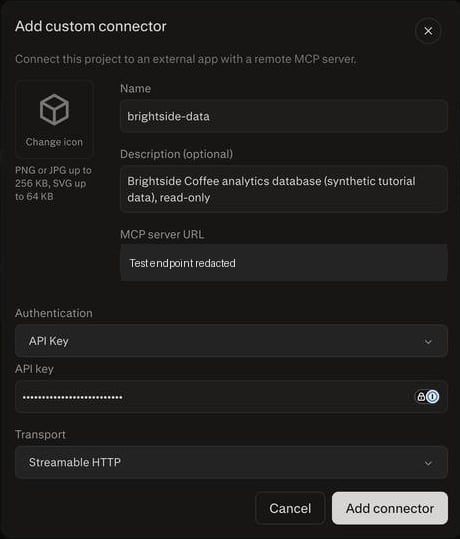
describe_tables, search_context, and run_sql; see the connector reference for Project-scoped credentials.
Save the customizations in a profile
On the Profiles page, create a Custom profile. This is the configuration your application will invoke by ID.
Paste the instructions below. They define the analyst’s role and output; the skill supplies its investigation method.
Copy the profile instructions
Copy the profile instructions
Ask your first question
From the folder containing theask.py you created above, activate the environment and enter your Project API key at the hidden prompt. Replace the profile placeholder with your saved ID.
Send the investigation to Agent API
Send the investigation to Agent API
input to client.responses.create(). Agent API uses the saved profile to give the agent its instructions, skill, connector, and tools. You do not write the investigation’s SQL in the application.
The sample ends on September 13, 2026, so use explicit dates rather than “last week.” Compare your agent’s output with these known non-test counts:
The expected finding is a measurement problem that prevents a confident conclusion about customer behavior. Recorded same-week conversions fall from 110 to 90, while mobile signup records disappear from September 9 through September 12. Non-test billing starts rise from 158 to 170 across the two weeks, so the signup and billing records do not tell the same story.
Missing signup records affect both the conversion count and its denominator. A higher observed conversion rate does not prove better purchase performance, and these tables cannot establish the true rate. Billing accounts without a signup in the same week may have signed up earlier; they are not all missing from the signup table.
Review the daily diagnostics as well as the headline: each must exclude test accounts. Device, segment, and plan breakdowns must keep the same calendar-week definition. If a required diagnostic fails, the answer should name the missing evidence instead of presenting the investigation as complete.
Agent API returns evidence you can inspect, not a guarantee of correct reasoning.
ask.py saves the complete response under runs/<response-id>/response.json; check executed queries and their outputs, not only SQL quoted in the answer.
Inspect the Agent API response
Inspect the Agent API response
Continue the conversation and get a chart
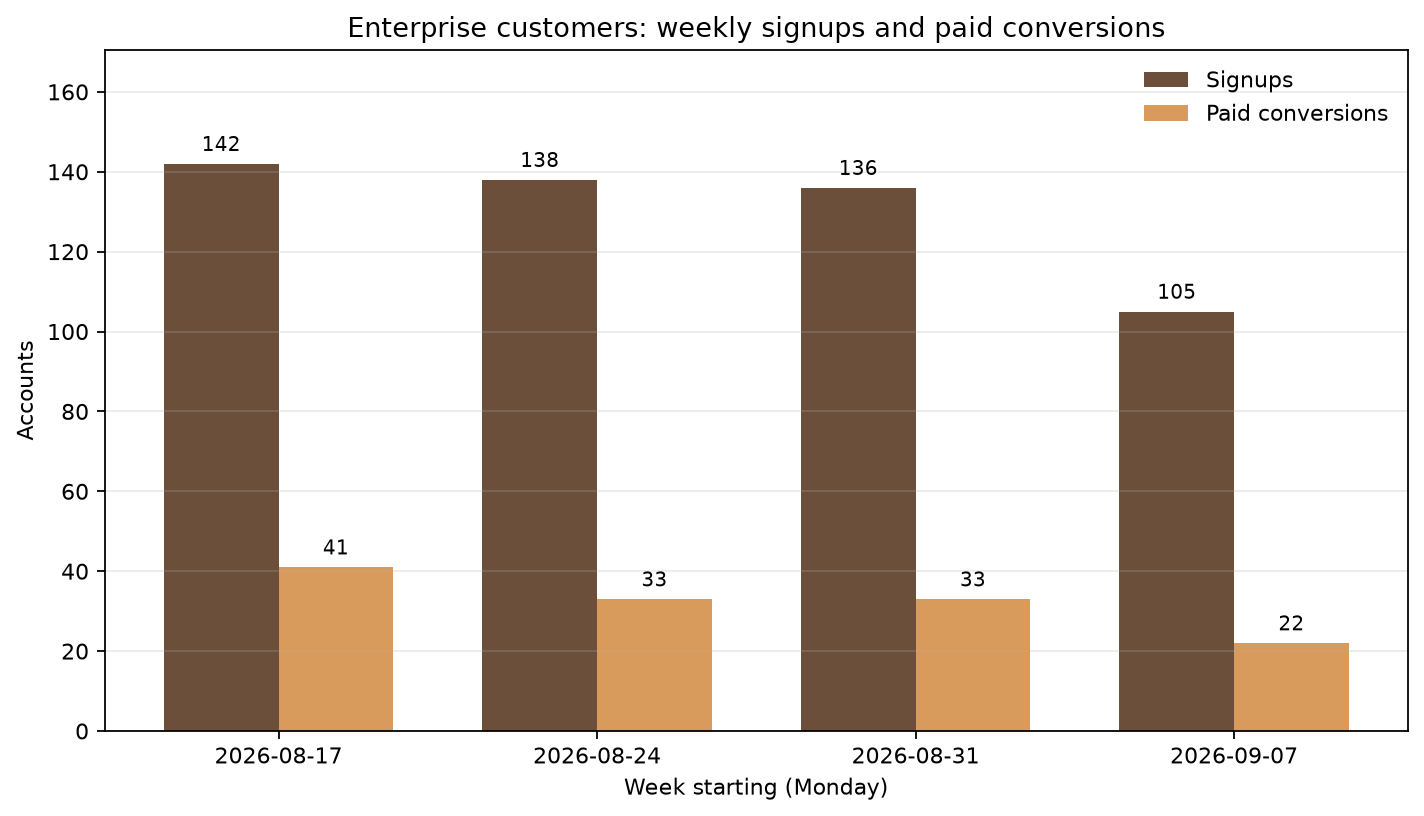
Next, ask the same agent to focus on enterprise customers. The client sendsprevious_response_id with your new question so the Agent API request continues the earlier conversation. Keep the profile unchanged during the walkthrough, and run the follow-up from the same working folder.
Request an enterprise chart in the same conversation
Request an enterprise chart in the same conversation
runs/<response-id>/files/.
Reuse the profile from another application
Another application can use the same profile with an API key from the same Project. Pin your tested profile version to keep later configuration edits from changing what that application requests.Request a tested profile version
Request a tested profile version
profile.version in the Agent API request. Replace YOUR_TESTED_VERSION with the version you verified; the expected count for this sample is 137. Pinning configuration does not freeze external data or guarantee identical answers. For a pinned conversation, pass the same --version on both the initial request and each follow-up.
Optional: compare a different model
The default model is sufficient for the investigation and chart. To evaluate another model, use--model to set the Agent API request’s model field while retaining the profile. The client supplies the output-token limit used for this Anthropic request. This is an optional evaluation, not a required step or a promise of equivalent analytical quality.
Override the model for one request
Override the model for one request
Recorded output excerpt
Recorded output excerpt
Run the sample server locally
Skip this section if your connector already reaches a hosted server. This supplies test data for the Agent API tutorial; it is not application-side agent orchestration. This path adds just one file,data_server.py, to your working folder. Install its dependency in the environment you created above:
Install the local MCP dependency
Install the local MCP dependency
Create the sample data server
Copy the complete code below intodata_server.py. This server supplies the connector’s data tools; Agent API still runs the investigation.
data_server.py
data_server.py
- Sample data:
build_rows()creates the same data each time.create_db()loads it into memory and enables SQLite’s query-only mode. No database or context file needs to be created. - Company context:
CONTEXTholds table descriptions, metric definitions, and the tracking-change note. - Connector tools:
describe_tables,search_context, andrun_sqlexpose the data. Context search matches every search word; SQL results are capped at 100 rows. - Server entry point:
RequireKeychecks the bearer token. The server requires a token and uses JSON responses over Streamable HTTP.
Make the server reachable
The connector needs a remotely reachable MCP endpoint. This local path uses Cloudflare’scloudflared tunnel; Agent API does not require Cloudflare. Install it with brew install cloudflared on macOS, or use Cloudflare’s downloads.
Use only synthetic data. In terminal 1, activate the environment, enter a random server token at the hidden prompt, and start the server.
Terminal 1: start the sample server
Terminal 1: start the sample server
Terminal 2: expose the local endpoint
Terminal 2: expose the local endpoint
/mcp, then the same server token. Check authentication before registering the connector.
Terminal 3: check the MCP endpoint
Terminal 3: check the MCP endpoint
401 without the token and 200 with it. Return to Connect the agent to your data to register the endpoint and finish configuring the profile.
When finished, stop only your local server and tunnel and unset exported token variables. Leave shared hosted services running. Keep credentials and raw responses out of source control.
Troubleshooting
- Connector unavailable: Check the server, token, URL, and Project. Restarting a quick tunnel changes its URL; replace the connector if you cannot edit that endpoint.
- No executed SQL: Inspect connector errors and Sandbox results, including nested exit codes. Proposed SQL and a
completedstatus do not prove a successful investigation or helper execution. - Wrong counts: Check the non-test filter and same-week boundaries. The server caps returned rows, not query computation.
- Missing chart: Inspect
share_fileitems and the file download step. Asandbox:path is not a local download. If Sandbox cannot locate the bundled helper, the skill permits an equivalent chart; verify the returned PNG and JSON rather than assuming that helper ran. - Incomplete response: Inspect the saved status, error, and incomplete details before raising the step budget.